
科学网—刊・见|气象学&海洋学领域SCI期刊Atmosphere-Ocean,收稿范围广泛-Taylor&Francis学术服务的博文
 精选
已有 371 次阅读
2026-10-26 14:34
| 个人分类: 地球科学 | 系统分类: 科研笔记
本期 【刊•见】 为诸位介绍气象学与大气科学领域的国际期刊—— Atmosphere-Ocean 。除了对关键指标进行详尽解读外,还将向您推荐刊内近三年高被引文章,以及近一年高阅读量文章:
1999—2023年加拿大及美国北纬40°以北地区云地闪电活动趋势
加拿大全国龙卷风气候特征的最新研究
基于降水量和日平均气温推断的加拿大降雪变化特征
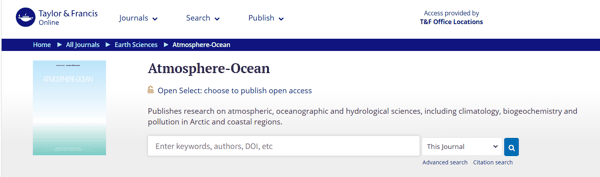 Online ISSN: 1480-9214 Print ISSN: 0705-5900
Atmosphere-Ocean 是加拿大气象与海洋学会(CMOS)的旗舰学术期刊,刊载大气、海洋、水文科学全领域原创研究成果,重点聚焦北极、海岸带及中高纬度区域研究。
期刊欢迎以英语或法语提交以下主题的应用或基础研究成果:
气候与气候学;
观测技术、遥感;
预报、建模、数值方法;
物理、动力学、化学、生物地球化学;
边界层、污染、气溶胶;
环流、云物理、水文学、大气-海洋相互作用;
波浪、海冰、能量交换及相关环境课题。
该期刊已被SCIE、Scopus等核心数据库收录。
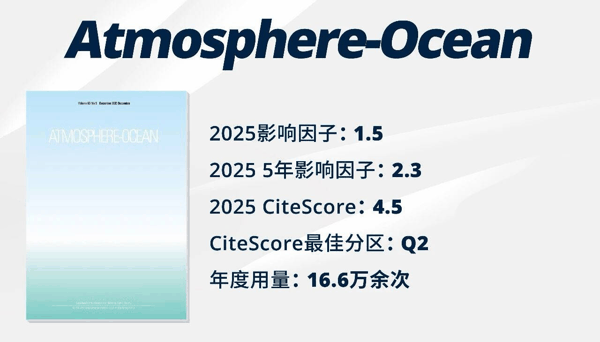
影响因子 根据JCR显示, Atmosphere-Ocean
在气象学与大气科学排名 98/114
在海洋学排名 49/67
Scopus 根据Scopus显示, Atmosphere-Ocean
2025年CiteScore为 4.5
在地球与行星科学:
海洋学排名 47/154
大气科学排名 66/160
作者须知 接收文章类型
Atmosphere-Ocean 发表原创性研究成果、综述文章、简讯以及对已发表论文的评论。
审稿周期
从提交稿件到获取初审意见,平均需要 11 天
稿件一旦接受后,在线出版平均需要 33 天
文章出版费(APC)
请访问期刊主页或Taylor & Francis Open Access APC Cost Finder查找适用于作者所在国家及不同文章类型的费用情况。 若您所在的机构或相关资助者与我们签有开放获取出版协议,您可能有资格获得APC支持,请访问我们的作者服务网站以了解更多!

Taylor & Francis现在开通APC便捷支付功能,可以一键通过微信、支付宝和银联使用人民币便捷付款。
编辑团队 Atmosphere-Ocean 期刊设置三位分领域主编,分别统筹气候模拟、海洋科学、气象学/大气科学三大版块编委横跨高校科研院所、国家级气象海洋业务部门,覆盖海气相互作用、极地 / 中高纬、遥感观测、数值模拟、生物地球化学、水文冰冻圈等领域。
主编
Marek Stastna
气候模拟版块主编

滑铁卢大学教授,主攻湖泊与近岸海洋中的分层流体动力学、气候动力学、多孔介质中的波动力学。
Nancy Soontiens
海洋科学版块主编

加拿大渔业与海洋局研究员,主攻沿海海洋建模和预报工作 ,擅长流体力学、沿海海洋学、边界层等领域。
Peter L. Jackson
气象学/大气科学版块主编

北不列颠哥伦比亚大学教授,研究中尺度气象学与天气尺度(天气系统尺度)气象学;复杂地形区域的大气动力与热力过程;风场及其时空变化特征;区域空气质量及大气污染物输送扩散;复杂地形条件下的大气环境过程及其环境效应;气象学在生态环境与环境污染研究中的应用等领域。
中国副主编
吴志伟

复旦大学大气科学研究院副院长、特聘教授、博导,研究领域为气候动力学,研究方向包括季风动力学,青藏高原气象学,中高纬-热带相互作用。
作者分布 根据JCR显示,近三年在 Atmosphere-Ocean 发文的国家/地区中,发文数量排名前三的有:
加拿大
中国
美国
近三年在 Atmosphere-Ocean 发文的全球高校和科研机构中,发文数量排名前三的有:
加拿大环境与气候变化部
加拿大渔业与海洋部
维多利亚大学
近三年内高被引文章 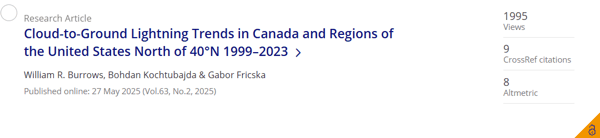
1999—2023年加拿大及美国北纬40°以北地区云地闪电活动趋势
作者: William R. Burrows et al.
点击查阅全文内容
文章摘要:
An assessment of the temporal and spatial trends in lightning activity in Canada and adjacent United States was undertaken using cloud-to-ground (CG) stroke data collected by the Canadian Lightning Detection Network from 1999 to 2023. The nonparametric Mann-Kendall test was used to identify monotonic trends in the data. The direction of trends was determined by the slope of a linear fit to the data. Common perceptions are that lightning will increase due to climate change, but at least in temperate latitudes, based on trends shown here the full picture is more nuanced. Total and negative-polarity CG lightning has shown a steady decline nationally in the observing period. The decline is most pronounced in Central Canada (Ontario and Quebec) and adjacent regions of the United States. Declines have also been detected over the eastern Prairies (SK and MB) and Atlantic Canada. An increasing trend, however, has been observed in the three northern territories, northern BC and northern AB. Sizeable areas of upward-trending positive CG lightning within wildfire environments have been detected. Observed trends in CG lightning may be explained by long-term changes in the continental-scale general circulation that are likely due to the onset of the positive phase of the Pacific Decadal Oscillation coupled with ENSO events occurring in a climate warming background.
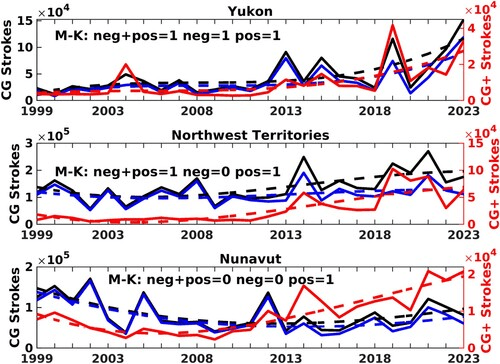 Fig. 3 Annual stroke counts 1999–2023 for YT, NT, and NU. Pl
近一年内高阅读量文章 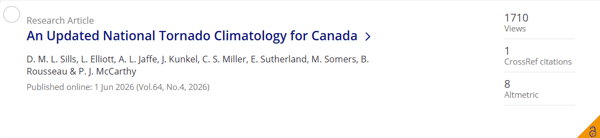
加拿大全国龙卷风气候特征的最新研究
作者: D. M. L. Sills et al.
点击查阅全文内容
文章摘要:
The first tornado dataset for Canada covered the years 1950–1979 and allowed a 30-year tornado climatology to be attempted. This was followed by a second 30-year national climatology covering the years 1980–2009. Guided by World Meteorological Organization recommendations, the current study is a 10-year update of the Canadian tornado climatology covering the years 1991–2020. Data conventions and quality control procedures developed by the Northern Tornadoes Project are used to ensure a high-quality, nationally consistent dataset, and are also applied back to 1980 for completeness. The updated 30-year dataset comprises 1948 tornadoes with the vast majority (88%) of these rated F/EF0-1, while 11% had a rating of F/EF2 and only 1% had a rating of F/EF3 or higher. Tornadoes were recorded in nearly every province and territory with the highest annual mean frequency in Ontario (18.5 tornadoes per year). Gridded tornado incidence values were highest in the southern Prairies and southern Ontario with a notable regional maximum in the area west of Toronto, even when only F/EF2 + tornadoes are considered. Tornadoes occurred most frequently from June to August and from 1600 to 1859 LT, inclusive. The median lengths and widths of tornado damage paths are 5615 and 260 m, respectively. F/EF2 + tornadoes were found to peak later in the year and later in the day, with more than double the median path length and path width. A total of 20 tornado outbreaks were identified.
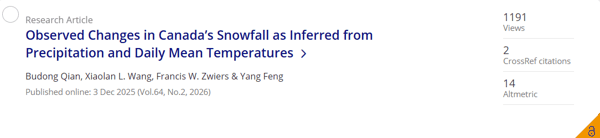
基于降水量和日平均气温推断的加拿大降雪变化特征
作者: Budong Qian et al.
点击查阅全文内容
文章摘要:
Limited long-term snowfall observations make it difficult to document how snowfall is changing across Canada. Proxy snowfall measures derived from more plentiful temperature and precipitation may therefore be helpful. We consider simple partitioning of daily precipitation into rainfall and snowfall based on whether temperature is above or below either 0°C or a station specific threshold. Using daily mean temperature and the fixed 0°C threshold resulted in more accurate estimates of annual and seasonal snow-day number and water equivalent snowfall amount than using daily maximum or daily minimum temperature. Using station-specific thresholds further improved estimation accuracy. Trends estimated from these proxy snowfall indices well match those estimated from observed snowfall data for periods and locations when both are available. The median annual proxy snowfall amount in Canada derived from homogenized daily precipitation and temperature data decreased 2.5% per decade over 1949–2023 south of 60°N and increased 0.5% per decade north of 60°N. Seasonally, annual proxy snowfall amount has changed most rapidly in winter, declining 2.6% per decade in southern Canada and increasing 3.6% per decade in northern Canada. This simple approach improves prospects for the continuation of long-term snowfall monitoring in Canada by exploiting long-term daily precipitation and temperature data.
为帮助更多科研人员选择更加合适的期刊,Taylor & Francis推出专栏—— 刊·见 , 该专栏致力于为读者和广大科研人员带来Taylor & Francis旗下期刊的详细解读,从期刊的基本情况、编委阵容、社会影响力到审稿速度、高被引文章等实用信息,专栏将为您带来最详细的介绍,让您更加全面地了解Taylor & Francis旗下优秀的国际期刊,帮助更多中国卓越科研成果顺利在国际期刊上发表。
以上内容可能更新,请以期刊官网主页为准。
点击此处 ,查看期刊最新数据和投稿详情!
转载本文请联系原作者获取授权,同时请注明本文来自Taylor & Francis 学术服务科学网博客。 链接地址: https://blog.sciencenet.cn/blog-3574014-1558250.html
上一篇: 传承经方智慧,推进科学研究:中医药国际期刊研究与实践汇编 欢迎参加科学网十佳博文评选活动! 主办单位:  支持单位: